Home     Simulation Procedure References Contact Us Kinematical Simulator Evans Group Home

Introduction

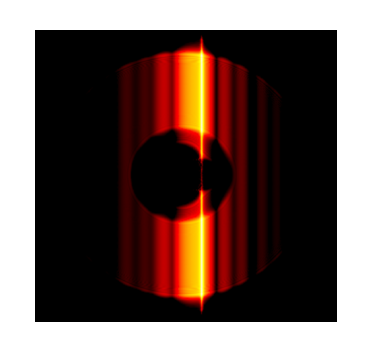
X-ray nanobeam diffraction experiments used tightly focused x-ray nanobeams to provide new ways to characterize the nanoscale structure of materials. These methods produce complicated distributions of scattered x-ray intensity that can be understood using optical simulations.

The programs on this web page simulate the diffraction pattern produced from an x-ray nanobeam diffraction experiment characterizing an epitaxial superlattice or single period film. Thin films such as semiconductors and complex oxides are the key component of electronic and magnetic devices, optoelectronic materials for semiconductor lasers, and emerging functional materials such as ferroelectric and multiferroic nanomaterials

The scattering from the sample uses the Darwin theory of dynamical diffraction for the substrate and recursive calculations for each mono layer on top of the substrate. Another method, the kinematical approximation (also called geometrical theory), assumes that each photon of the incident x-ray beam is only scattered once and the subsequent interactions with matter are neglected [4]. As opposed to the kinematical approximation, the dynamical theory of diffraction accounts for these subsequent interactions and includes certain effects of the scattered amplitude. Dynamical theory includes the absorption of x-ray intensity through the film, the shift in reflections due to refraction, and interference of the substrate reflection with diffraction from the thin film [2]. In result of the dynamical theory including the interference between the intensity of the thin film and infinite substrate the magnitude of the substrate peak is observed as reasonable value. The nanobeam simulator on this website imploys the dynamical theory through the multiplication of the angular spectrum of the focused wavefield and the dynamical diffraction function for a particular sample and the angular spectrum of the incident wavefield. The calculation is based on the propagation of a coherent, monochromatic beam through focusing optics to the sample, then to the detector. Finally, the distribution of x-ray intensity on the detector is computed using the square magnitude of the scattered amplitude.
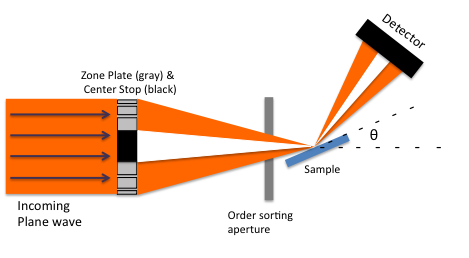
(a)
(b)
FIG. 1. (a) Diagram of the optical arrangement for the simulation viewed from above the scattering plane (b) 3-D schematic diagram of the optical arrangement viewed from the front of the sample. The substrate is shown in purple and the thin film heterostructure superlattice is shown in blue and gray.

Simulation Methods

Experimental Setup

The simulation on this webpage matches the experimental arrangement for an experiment characterizing Si/SiGe heterostructures by Tilka et al. at Sector 26 of the Advanced Photon Source [1]. Crucially, the sample is placed at the center of rotation of a diffractometer and characterized using radiation at the first order focus of the zone plate.

The parameters of the focusing optics and a diagram of the experiment are shown below.

Incident Beam

Zone Plate

Center Stop

Order Sorting Aperture

Detector


Computational Methods

Incident Beam

The incident beam was simulated by propagating a radially symmetric wavefield of unity amplitude through the zone plate to the order sorting aperture (OSA) and from the OSA to the first order focus. The phase pattern introduced into the beam by the zone plate was calculated at each radial point and propagated to the OSA using the Fresnel diffraction integral operator [3]. The wavefield at points outside the aperture of the OSA was set to 0. The beam was propagated from the OSA to the first order focus using the same propagation method.

The Matlab code used to generate the incident beam is listed under source code and can be modified to simulate experiments using other optical arrangements, including different zone plate geometries, OSA diameters, and x-ray photon energies.

The simulation as implemented here is based on the focused wavefield produced using the parameters listed in the table above. In practice, the angular spectrum at the sample was saved to a binary data file that the web simulation reads and uses to simulate the diffracted intensity distribution.


Dynamical Theory Calculations

We have also included a simulation of an intermediate step in the simulation of the nanobeam diffraction experiment. There are two current predictions for the magnitude of the diffracted intensity known as the kinematical approximation and dynamical theory. The kinematical theory is valid for a crystal that has a thickness smaller than the extinction depth, which is dependent on the type of material and the energy of the light penetrating it. When a crystal has a thickness greater than the extinction depth the kinematical theory breaks down and the angular width predicted differs significantly than the more accurate dynamical theory. To use the dynamical theory model, which allows the substrate and any thicknesses above the extinction depth to be included, there are a few steps that need to be accomplished before calculating the diffracted intensity.

  1. Define Parameters for each Layer in the Heterostructure

  2. Certain parameters for each layer of the sample including the substrate must be calculated in order to start the procedure for the simulation. These four parameters for each layer in the structure include the unit cell structure factor \(F_{hkl}\), the unit cell structure factor in the forward direction \(F_0\), the scattering for one atomic layer \(g\), and the scattering for one atomic layer in the forward direction \(g_0\). The equations for these parameters are given as $$\begin{matrix}F_{hkl}(Q) = \sum\limits_{j}(f_j^0(Q)+f_j'+f_j'')e^{Q~ \cdot ~r_j} \\ F_0 = \sum\limits_j(Z_j + f_j' + if_j'') \\ g = ({2d^2r_0\over {mv_c}})F_{hkl}\cos(2\theta_i) \\ g_0 = ({2d^2r_0\over {mv_c}})F_{0} \end{matrix}$$ Here \(j\) labels the atoms of the unit cell, \(f_j^0\) is the atomic form factor [7], \(f_j'\) and \(f_j''\) are the dispersion corrections to the atomic form factor [8], \(Q\) is the scattering wave vector, and \(Z_j\) is the atomic number. In the scattering for one atomic layer \(d\) is the longest lattice spacing, \(r_0\) is the thompson scattering length, \(m\) is the order of reflection, and \(v_c\) is the unit cell volume. For the out of plane direction \(d^2 \over {v_c} \) reduces to \(c \over {a^2}\) where c and a are the out of plane and in plane lattice constants respectively and a is assumed to be the in plane lattice constant of the substrate. In addition, g is multiplied by the polarization factor \(\cos2\theta_i\) because of the \(\pi\)-polarized incident beam at Sector 26 of the APS. For an incident beam of \(\sigma\)-polarization the factor in g would be replaced by unity [6]. Each of these four parameters are complex due to absorption through the dispersion corrections of the atomic form factor and will be used in the subsequent steps in order to calculate the final intensity reflectivity of the sample.

  3. Calculate substrate reflectivity

  4. The second step to using dynamical theory is to calculate the substrate reflectivity, \(R_0\), using the standard Darwin theory. If simulating a free standing multilayer with no substrate the parameter \(R_0\) is set to 0. In normal circumstances the substrate is included and the relative deviation from the Bragg condition must be calculated as the variable ξ: $$\xi = {Q \over {mG}}-1 = {Qc\over{2\pi}m} - 1$$ where \(G\) is the reciprocal space lattice vector (\(G = {2\pi \over c}\) for the out of plane direction) [6]. After the relative deviation from the Bragg condition is calculated the complex variable \(x_c\) is introduced, which contains the addition of the complex part of scattering amplitude due to the dispersion corrections. The reflectivity from the substrate, \(R_0\) can finally be calculated from the following equation: $$R_0(x_c) = \begin{Bmatrix}x_c - \sqrt{x_c^{2}-1} & ~~~~~~for ~~Re(x_c) \geq 1 \\ x_c - i\sqrt{1-x_c^{2}} & ~~~~~~~~for ~~|Re(x_c)| \geq 1\\ x_c + \sqrt{x_c^{2}-1} & ~~~~~~~~for ~~Re(x_c) \leq -1 \end{Bmatrix}$$
  5. Recursively Calculate the Reflectivity of each Unit Cell

  6. For the final scattered amplitude to be obtained the reflectivity must be calculated recursively. This reflectivity is given as $$R_k(Q_z) = -ig + {(1-ig_0)^2 \over {ig + e^{-2i\phi}R_{k+1}^{-1}(Q_z)}}$$ which is derived from the recursion relations for adjacent planes of the film[4]. In this expression \(\phi={2\pi \over {\lambda}} c \sin\theta_i \) is the phase shift of the forward scattered wavefield, \(\lambda\) is the x-ray wavelength, and \(k\) is numbered from the bottom most layer at the surface of the substrate (\(k=-1\)) to the surface of the film (\(k=-N\)). The procedure is as follows: first \(R_0\) is either set to the substrate reflectivity using the Darwin theory or 0 for a simulation without a substrate, next the \(R_0\) is inserted into the expression for \(R_{-1}\) where \(k=-1\), lastly this is repeated for \(N\) unit cells in the film using the correct parameters of each layer [5].

  7. Take the square magnitude of each discrete point

  8. After the reflectivity is recursively computed for each discrete point of reciprocal space coordinates the intensity is plotted by taking the square magnitude of the scattering amplitude \(R_{-N}\) against the incident angle of the x-ray plane wave. This plot represents the structural information of the sample along the axis of reciprocal space extending along the surface normal. The range and discretization of the plot is set by user input.


Diffraction Pattern Simulation

The diffraction simulation reads the angular spectrum of the data file generated by the focused wavefield optical simulation described above. The data file represents the intensity of each wave vector, k, in the incident beam. The calculation of the diffraction pattern from the incident beam is outlined below.
  1. Generate a set of wave vectors in cartesian coordinates with \(k_x,k_y\) and \(k_z\) components representing each pixel of the incident beam angular spectrum. The range and discretization of the wave vectors is arbitrarily set by the real space coordinates of the incident beam. The wave vector coordinates are then rotated into the sample reference frame so that the z direction is perpendicular to the surface of the sample. The \(k_z\) component of each wave vector in the sample frame is proportional to the wave vector transfer, \(Q_z\) [3].

  2. Calculate the reciprocal space lattice positions of each wave vector for each layer of material. Again, the h and k positions are fixed at 0 and l changes with angle of incidence of the wave vector. The unit cell structure factor is calculated using the reciprocal space lattice positions.

  3. Calculate the reflectivity for each \(Q_z\) coordinate of the incident angular spectrum using the same method outlined in the dynamical theory calculations. The diffraction pattern is then computed by multiplying the angular spectrum of the focused wavefield and the reflectivity from the dynamical diffraction function calculated for each wavevector coordinate. Lastly the intensity is calculated by taking the square magnitude of the diffracted wavefield


Approximations/Assumptions

Material Scattering Factor

For alloy materials, the atomic scattering factor is calculated, then a weighted average based on the composition of each material is used to calculate the material scattering factor. These averages are listed below.

SiGe - Scattering factor is calculated assuming 70% Silicon and 30% Germanium.

AlGaAs - Al/Ga scattering factor is calculated assuming 25% Gallium, 25% Aluminum.

InGaAs - In/Ga scattering factor is calculated assuming 25% Gallium, 25% Indium.


Source Code Downloads

To download the source code for each part of the simulation, click the buttons below.

Incident Beam (MATLAB)

Dynamical Diffraction Simulation (c programming)

Dynamical Curve Simulation (c programming)